



A thesis went viral on October 3, 2026: "no one uses AI. I repeat, absolutely no one. We live in a bubble." The author, Nicolas Bustamante, who works on AI for knowledge workers at Microsoft, added that even friends who pay for ChatGPT, asked to show their queries, use "the same handful of basic things," often do not know they can upload a photo and ask questions about it, and are surprised that an agent can read and send email or check them into a flight.
The post quoted an a16z chart that had circulated a day earlier: 98% of US households are not paying for AI yet. Both items reached tens of thousands to over a million people, and the replies split between "obvious" and "this data is off."
This post lines up the numbers, the best objections, and the one conclusion that survives all of them: the gap is less about awareness of AI than about depth of use.
TL;DR — what people are asking
| Question | Short answer |
|---|---|
| What did a16z report? | About 2.2% of US households paying for AI, citing PNC Research internal data |
| Is that a national census? | No. It is one bank's card data; see the caveats |
| How many people use AI? | 49% of US adults use chatbots, 44% use ChatGPT (Pew, Feb 2026) |
| Do those conflict? | No: use is wide and mostly free; paying is rare |
| What is the thesis? | Most users do a handful of basic things and do not know what is possible |
| Does data support it? | Partly: top uses are information search and basic work tasks |
| Biggest objection? | People rationally do not pay when they do not need it |
| What matters most? | Depth of use, which is a skills and habits problem |
The numbers, side by side
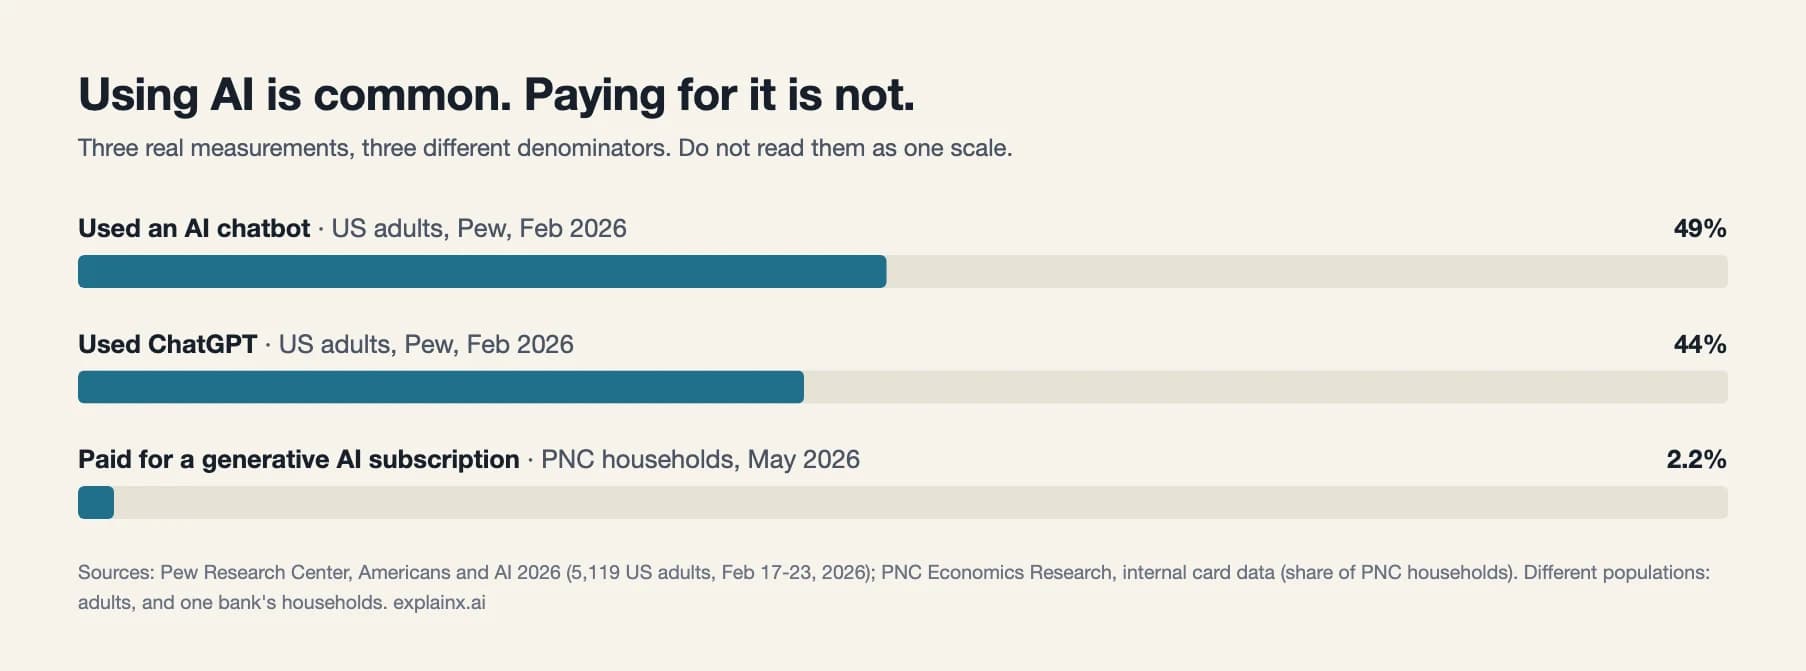
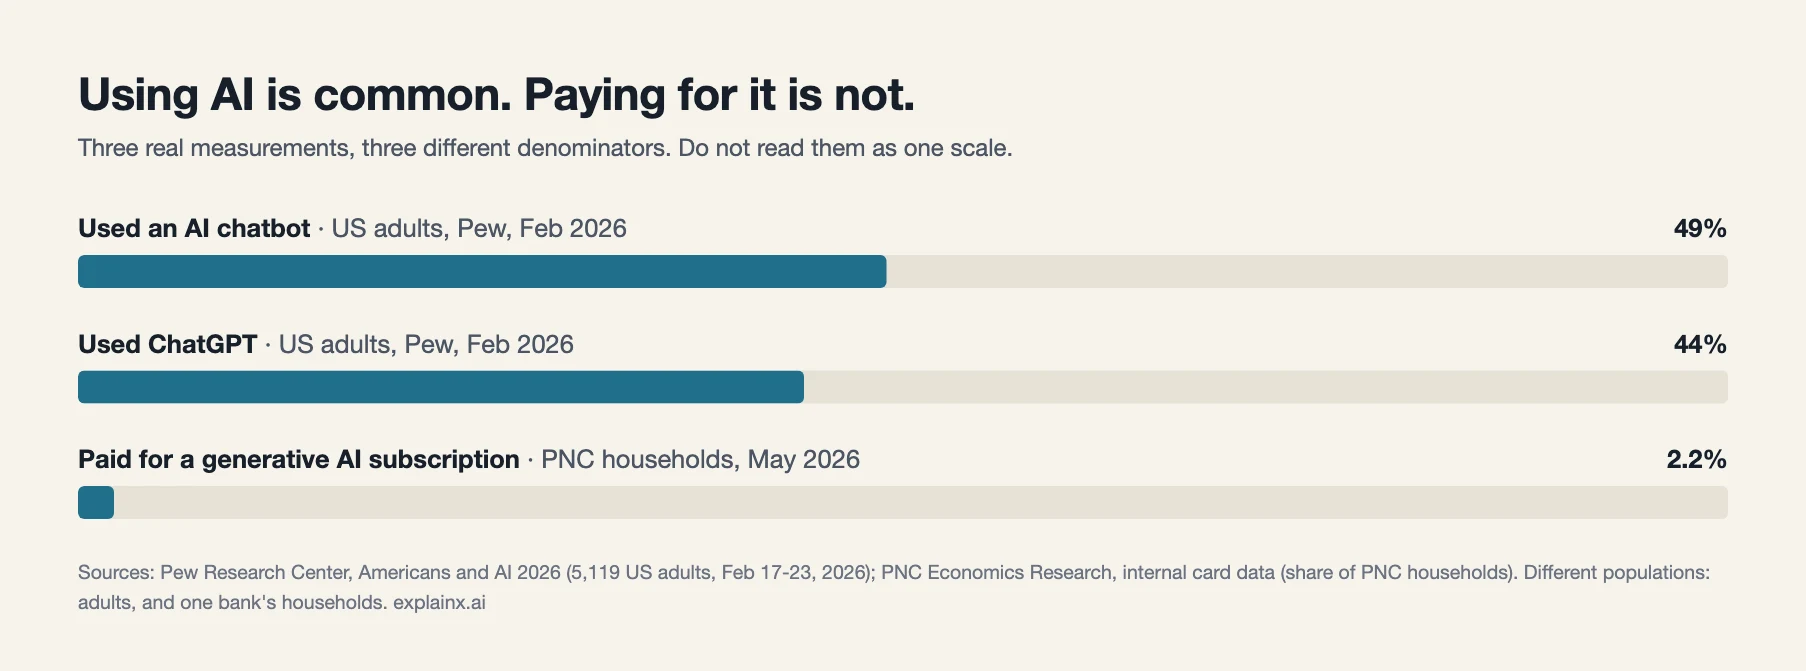
Here are three measurements that are often confused because they sound like they measure the same thing.
| Measure | Value | Source and population |
|---|---|---|
| Used an AI chatbot | 49% | Pew Research Center, 5,119 US adults surveyed February 17 to 23, 2026 |
| Used ChatGPT | 44% | Pew, same survey |
| Paid for a generative AI subscription | 2.2% | PNC Economics Research, share of PNC households in card data |
The first two are adults; the third is households at one bank. They are different denominators, which is why the chart is labeled and why we do not draw a single scale through them. The comparison is still instructive: use is in the tens of percent, paying is in the low single digits.
a16z's chart
a16z Growth published a time series of the share of US households with paid AI subscriptions, attributed to PNC Research internal data dated July 13, 2026. It starts near zero in early 2023 and ends at the labeled 2.2%.
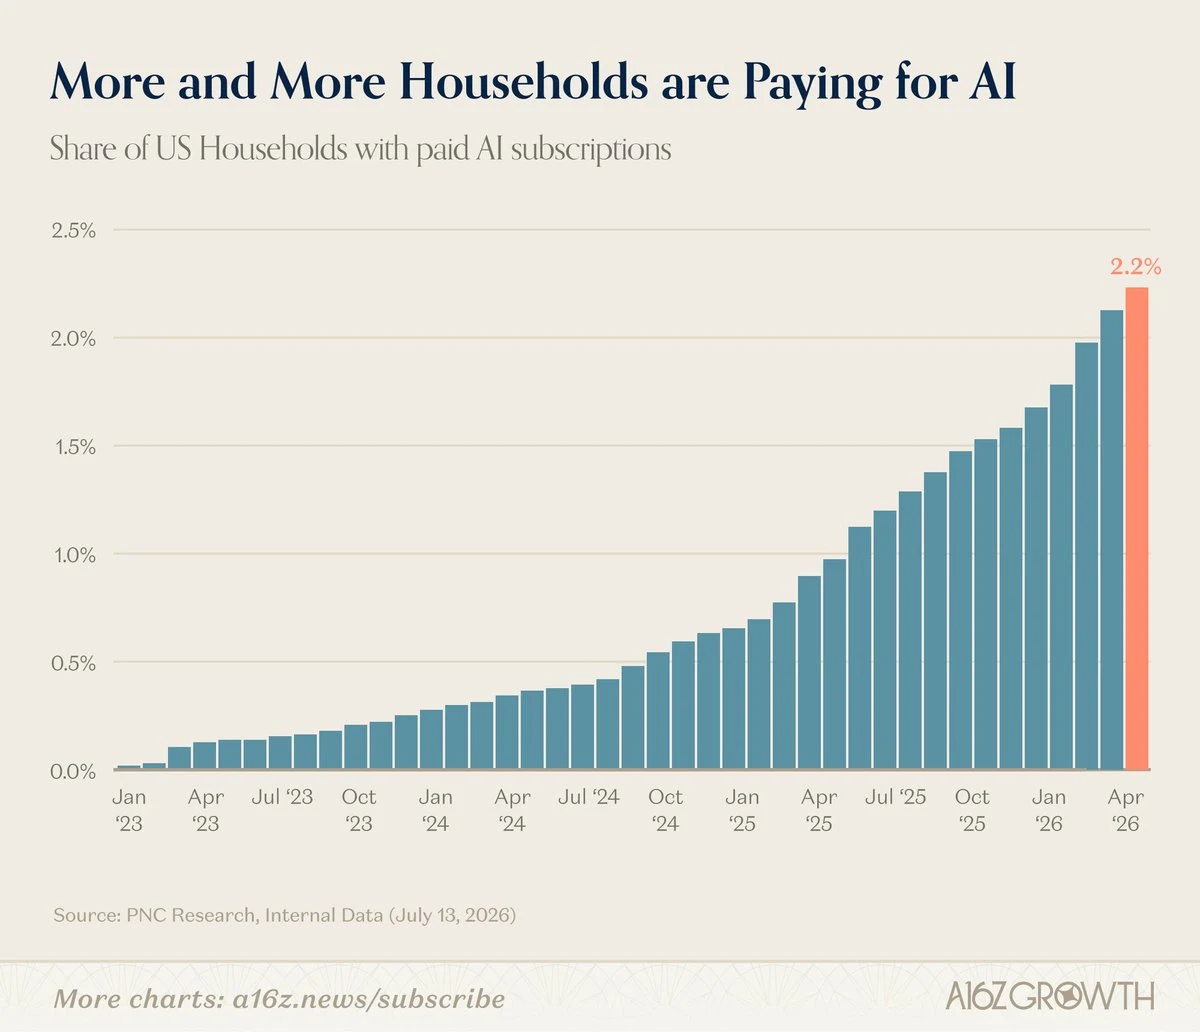
Chart: a16z Growth, using PNC Research internal data (July 13, 2026). Reproduced with attribution from a16z's public post. a16z labels the final bar April 2026; the PNC report cited in our earlier coverage dates the same 2.2% to May 2026, so treat the exact month as approximate.
In the accompanying essay, David George writes that as of April barely about 2% of US households were paying for some AI service, and that the number is higher now and growing but still small. George uses it to argue that GPU demand is strong even though mature adoption is early: the infrastructure is running hot while usage penetration is low. The essay also notes that about 30% of S&P 500 companies report quantifiable impact from AI, while only about 2% track specific metrics. Those enterprise figures come from the essay as summarized; the method behind them was not detailed in the passages we could read.
For the full mechanics of the PNC number, including what it measures and the roughly "three million households" arithmetic, see our earlier explainer: Only 2.2% of households pay for AI.
What the "3% threshold" chart says, and how much to trust it
A second chart in the thread lists the approximate year about 3% of US consumers had adopted or paid for each technology:
| Technology | Approximate year | Definition |
|---|---|---|
| Personal computer | 1983 | About 3% of US households owned a computer |
| Paid home internet | 1995 | About 3% of Americans paid for home online access |
| Smartphone | 2006 | About 3% of US mobile users owned a smartphone |
| Paid consumer AI | 2026 | About 3% of US consumers purchased AI |
The chart's own footnote says definitions differ by technology, so the years are approximate. We could not trace its authorship, and its sources are listed as a mix of historical estimates, Pew's 1995 online study, comScore, and consumer transaction data. Treat it as an illustration: the claim is that paid AI is roughly where earlier mass technologies were at the start of their steep part. Note also that the other chart shows 2.2% rather than 3%, so the table treats the threshold as approximately reached rather than measured. Analogies like this are suggestive, not predictive; plenty of technologies sat at a few percent for years.
A viral comparison to treat carefully
A third chart claimed that more US households pay for sports betting (5%) than for AI (2.2%), alongside streaming video at 91%, Amazon Prime 58%, cable or satellite TV 41%, and so on. We could not verify its sourcing. One number conflicts with our earlier PNC-based coverage, where streaming reached 43% of households rather than 91%, which suggests the charts use different definitions or sources. Do not repeat the betting comparison as established fact. The qualitative point, that a $20 tool lags well behind entertainment subscriptions, holds regardless.
The use gap: what the data supports
Bustamante's claim is that even paying users do the same basic things. That is partly testable. Pew's survey of chatbot users finds the most common uses are:
| Use | Share |
|---|---|
| Searching for information | 42% of users |
| Work-related tasks | 38% of employed adults |
| Entertainment | 25% |
| Creating images or video | 24% |
| Medical advice | 20% |
| Diet and fitness information | 20% |
| Emotional support | 10% |
Information search leads, which is the lowest-ambition use: asking a chatbot what a search engine would answer. About a quarter of users use chatbots daily, and age matters a lot: Pew found people under 50 roughly twice as likely as those 50 and older to use ChatGPT (57% versus 28%).
None of this proves that users are unaware of photo upload or agents, but it fits the picture. A category as large as "information searching" signals a default pattern, and the interesting capabilities, connectors that read your mail, agents that operate a browser, projects with memory, are at the far end of the curve. Our coverage of why AI agents have not gone mainstream argues the same from the product side.
The best objections
"People rationally do not pay because they do not need it." A reply to the thesis made this point, comparing it to phones: people buy what meets a need. It is right for some people. Free tiers cover casual use well, and many daily lives have no task that obviously benefits. But need is partly a function of knowing what is possible. Nobody needs a capability they have never imagined, and awareness spreads slowly.
"The data is off: OpenAI has over a billion users." One reply doubted a 2.2% figure given ChatGPT's huge user base. The numbers answer different questions. A billion-user figure counts people worldwide, mostly on free plans; the 2.2% counts US households paying through cards at one bank. Neither contradicts the other. The PNC series also has real limits: it reflects PNC's customers, it sees card payments to AI merchants, and subscriptions bought through app stores, billed by employers or paid in other ways may not be counted as AI spend. The source materials do not say how those cases are handled, so the figure is best read as a lower bound on a particular kind of payment.
"This will not spread through websites, it will come through the phone." Another reply argued that AI reaches the mass market when iOS and Android ship agents that can do most things a person does on a phone, and noted how large the gap is between Siri and a model with connectors today. That is plausible, and it matches how earlier technologies went mainstream, through defaults rather than downloads. It also means platform owners' permission models matter, as Apple's recent changes to Full Disk Access for AI agents show; see our report on that.
"The top 1% do not represent everyone." One reply doubted that most people will ever run multiple agents in terminals. Agreed. The relevant comparison is not the top 1% of power users but everyday tasks like purchasing, travel, and administration, where an agent could do real work.
Why it matters
Bustamante's closing line is a useful stress test: imagine the compute shortage when everyone uses AI like today's top 1%. If usage depth rises even modestly across a base that already has access, demand for inference rises sharply, which is the logic behind a16z's note that GPUs are running hot while adoption is immature. We have seen early signs of that tension in AWS Capacity Blocks pricing and in OpenAI pausing a capable model over capacity and security concerns.
It also reframes where the opportunity is. If the constraint were awareness, advertising would solve it. If the constraint is skill and habit, the answer is teaching, templates and onboarding, which is why enterprise ramps look different from consumer ones; see Anthropic overtaking OpenAI in business adoption and a16z's own view of distribution in David George on OpenAI's distribution and customers.
Close your own gap this week
Whether or not the thesis is right about everyone else, you can test it on yourself. Pick two of these, use them on real tasks for a week, and write down what changed.
- Ask questions about a photo or a file. Upload a receipt, a whiteboard, a contract page, a chart, and ask what it says and what to check.
- Use voice for a long ramble, then ask for a structured summary.
- Give it your context once. Use projects or custom instructions so you stop re-explaining who you are and what you do.
- Connect one low-risk data source, read-only. A calendar or a single mailbox label is a better first step than your whole inbox. Read our agent security section before granting broad access, and our explainer on indirect prompt injection.
- Let an agent do one errand end to end, such as comparing options or filling a form, with approval before anything is sent or bought.
- Use it on your money, carefully. ChatGPT Finances and our guide to AI for personal finance show what is possible and what to guard.
- Teach one person. The fastest way to find what you do not understand is to explain it.
If you run a team, the same logic applies at scale: a short, hands-on session where people bring their own tasks changes more behavior than a tools announcement. That is the premise behind explainx.ai's live workshops, and our AI builder bootcamp guide lays out a path from first prompts to building.
What people are asking
Is 2.2% a bad sign for AI companies?
It is an early number on a steep curve: the a16z chart rises from near zero in early 2023. It also shows how much of the market is still unpaid. Whether the paying share reaches the levels of streaming depends on whether free tiers and bundled features crowd out subscriptions.
Is the thesis "no one uses AI" literally true?
No, and its author frames it as exaggeration for effect. Pew finds about half of US adults use chatbots. The sharper claim is that most use is shallow. The data supports that more than it supports the literal reading.
Why did the number get so much attention?
It lands on an unresolved tension: enormous capital spending on one side, and low paid adoption on the other. Both optimists and skeptics can read it as support.
What would change the picture?
Defaults and bundling (AI inside the phone, the browser and work software), cheaper or free capable tiers, and visible, trusted use cases such as travel and purchasing. Education helps, but platforms move faster.
Honest limitations
- The 2.2% figure is one bank's card data, with a month label that differs between sources (April on a16z's chart, May in PNC's report), and the app-store and employer-payment caveat is unresolved in the sources.
- The 3% threshold table and the sports-betting chart circulated in the thread, and we could not verify their authorship or sourcing; use them as illustrations only.
- Pew's use-case percentages have different bases (users, or employed adults), as listed.
- Quotes from the thread are paraphrased from public posts; we did not verify the poster's claims about their friends.
Bottom line
The 98% figure is real but narrow: a bank's view of who pays. Pew's survey shows usage is far broader, mostly free and mostly basic. Together they describe a technology with wide reach, shallow use and a lot of unrealized value, which makes depth of use the bottleneck. You can test that on yourself this week, and if the thesis holds, the most valuable thing you can do is learn one more capability and show it to someone else.
Related on explainx.ai
- Only 2.2% of households pay for AI: what PNC measured
- Why AI agents have not gone mainstream
- Polymarket: AI adoption and entry-level hiring
- Anthropic overtakes OpenAI in business adoption
- a16z's David George on OpenAI's distribution
- ChatGPT Finances now free for US users
- Complete AI builder bootcamp guide
- Always-on agents and security
Sources: a16z, State of Markets II · Pew Research Center, Americans and AI 2026 · PNC Economics Research, Consumer Health Check
Figures reflect the sources as of October 3, 2026. The a16z chart is reproduced with attribution; the use-versus-pay chart is explainx.ai's own.