




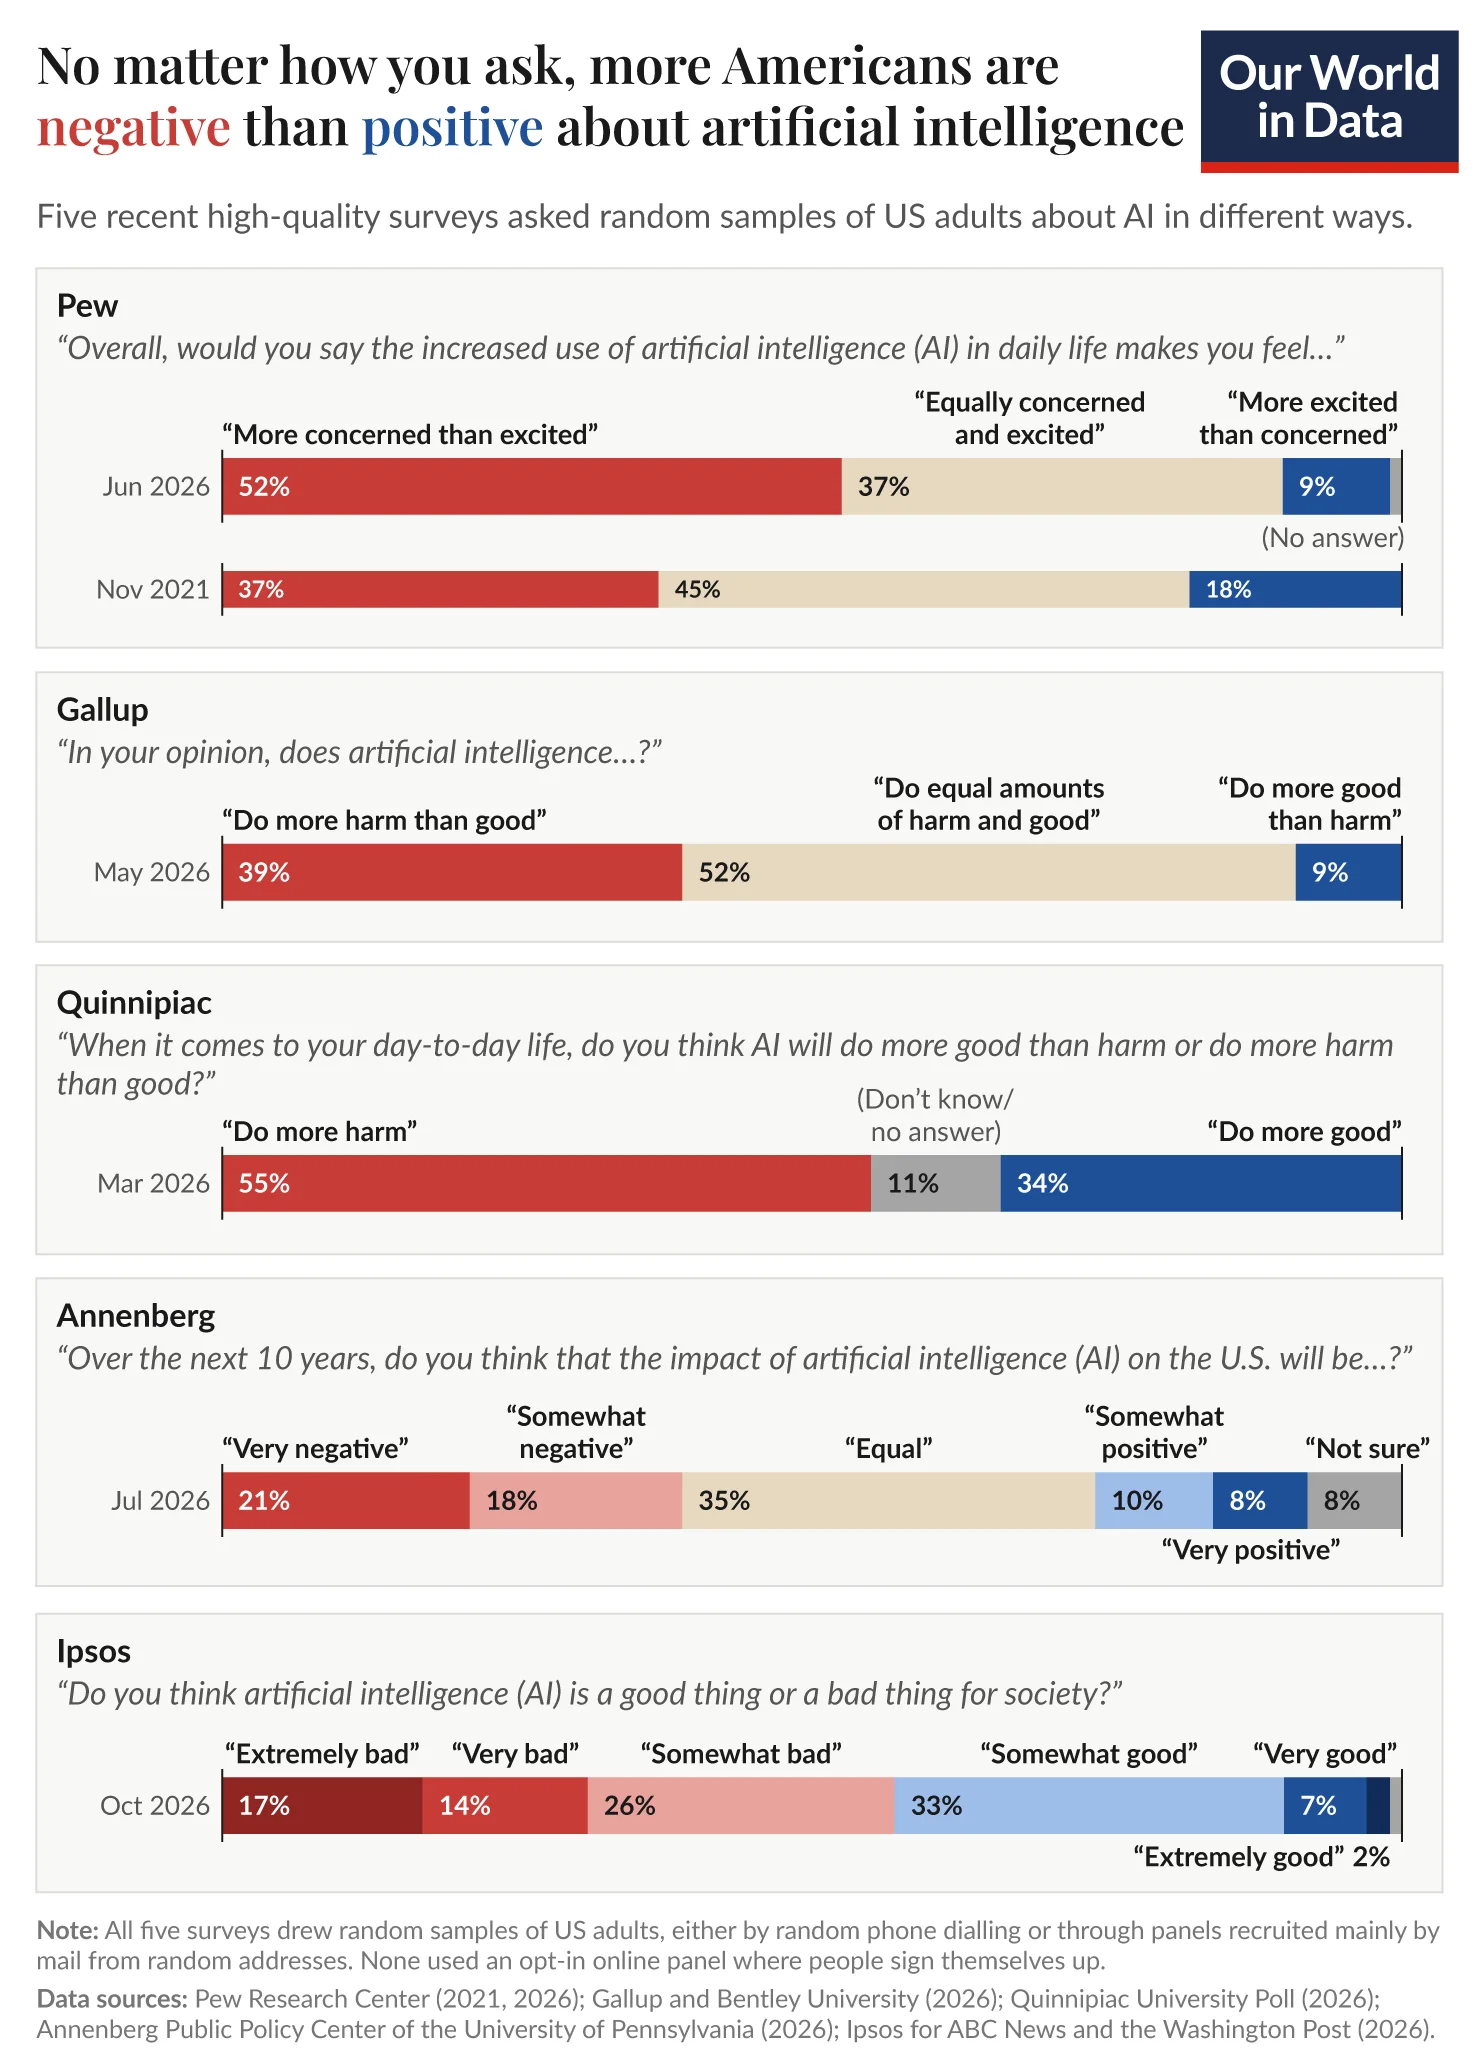
More Americans are negative than positive about artificial intelligence no matter how pollsters phrase the question — that is the conclusion of Max Roser’s November 16, 2026 Our World in Data article synthesizing five probability-sample US surveys from Pew, Gallup, Quinnipiac, Annenberg, and Ipsos. The piece lands beside explainx.ai’s ABC/Post/Ipsos data-center opposition tracker but adds cross-survey discipline: Roser refuses opt-in panels that inflate outrage.
For product leaders, the read is blunt: excitement is a niche; concern is the default mood.
TL;DR
| Survey family | Roser’s headline take |
|---|---|
| Pew (Jun 2026) | 52% more concerned vs 9% more excited |
| Gallup / Bentley (May 2026) | Only 9% pick the most positive option when offered |
| Ipsos (Oct 2026) | 17% say AI extremely bad for society vs 2% extremely good |
| Quinnipiac (Sep 2026) | 73% see some existential risk from future AI |
| Partisan split | Concern majorities in both parties per Pew |
Why Roser combined five polls instead of one
 Five US survey wordings showing more Americans negative than positive on AI
Image: Our World in Data
Survey wording shifts answers. When polls offer a neutral middle, many respondents take it — Pew’s 37% neutral bucket shrinks headline positivity. When forced toward ends, negative answers dominate.
Roser’s methodological guardrail: only probability samples:
- Quinnipiac — random digit landline and mobile dialing
- Pew, Gallup, Annenberg, Ipsos — mail-recruited panels weighted to US adults
He excludes opt-in web panels after examples like a viral 20% “Holocaust is a myth” stat among young Americans that Pew’s panel put near 3%. For AI policy, that matters because Twitter volume is not electorate mood.
What changed since 2021
Pew’s concerned-vs-excited ratio moved from ~2:1 (2021) to >5:1 (2026) in Roser’s telling — a sentiment slope, not a one-week spike. Pair that with:
- China AI literacy curriculum fights
- South Korea CSAT AI cheating panic
- UK agentic security unit proposals
Global North education and security systems are reacting faster than consumer marketing admits.
Existential risk numbers need careful quoting
 Antitrust-style platform power metaphor for concentrated AI risk perceptions
Quinnipiac’s September 2026 survival question (cited via Roser) found:
- 38% very concerned
- 35% somewhat concerned
- 14% not so concerned
- 11% not concerned at all
That is not a forecast from AI labs — it is public fear polling. Builders should separate model capability roadmaps from voter perception when lobbying for data centers or classroom tools.
Personal benefit vs societal harm
Roser highlights tension in Ipsos:
- 50% say AI good for you personally vs 49% bad
- Yet 17% extremely bad vs 2% extremely good on societal questions
- Quinnipiac March 2026 item: 55% expect day-to-day harm vs 34% net good
Product implication: individual productivity wins do not automatically translate to social license. See Apple health AI usage studies for clinical contexts where safety stats must be public to earn trust.
What builders and policy teams should do
- Publish limitations alongside capability — Roser’s closing line: industry must take concerns seriously to earn trust.
- Map concerns to product decisions — data retention, opt-out, labor impact, not only benchmark tables.
- Avoid dunking on poll respondents — concern is rational when synthetic voice 911 swatting and agent breaches make headlines.
- Use probability samples when citing US mood internally — not engagement analytics from social apps.
What product managers ask after reading Roser
If 50% say AI is good for me personally, why ship fear-based ads? Because extreme negatives outnumber extreme positives on societal questions — brand campaigns that ignore 17% extremely bad reactions invite backlash, especially near data-center protests.
Do Republicans love AI and Democrats hate it? Pew still shows majorities concerned in both parties — polarization is degree, not direction.
Should we trust Quinnipiac survival polling? Use it for comms risk, not model eval. Capability reports belong in METR-style claimed vs verified posts.
How does this affect enterprise sales? Procurement will ask labor, privacy, and energy questions earlier — prepare answers like American Express workforce AI cuts coverage does for internal comms.
Are opt-in Twitter polls useless? Roser says yes for population inference — still useful for qualitative quotes, not percentages.
Limitations Roser acknowledges
Roser notes wording effects and refuses opt-in panels — but even probability samples lag events. The surveys predate some November headlines (OpenAI healthcare agents, GTIG agent attacks). Mood can move faster than panel field dates. Treat numbers as directional, not prophecy.
Global context (brief)
Americans are not alone in skepticism — Roser’s article is US-specific. Pair with China literacy mandates and UK agentic security units to show governments react to the same trust deficit.
How Roser’s chart should be read in workshops
Training teams on AI literacy should show the five-question grid side by side so learners see wording effects. That pedagogy mirrors England secure assessment shifts and China’s 2030 literacy plan.
Survey-by-survey notes (for communicators)
Pew (June 22–28, 2026, n=3,488): Roser highlights the concerned vs excited split and partisan breakdown. Useful when executives claim “only tech Twitter hates AI.”
Gallup / Bentley (May 4–11, 2026, n=3,270): Business-school partnership framing — good for enterprise sales decks about workforce anxiety.
Quinnipiac (March and September 2026): March poll on day-to-day harm expectations; September on survival — different fear vectors, same negative skew.
Annenberg (June 16–July 19, 2026, n=1,320): Probability panel; cite when rejecting viral opt-in stats.
Ipsos for ABC/Post (October 9–13, 2026, n=2,545): Pairs with explainx.ai’s 57% bad for society infrastructure story.
Implications for AI product roadmaps
| Function | Response to negative skew |
|---|---|
| Policy | Publish eval summaries, not only demos |
| Support | Expect refund pressure on “AI features” |
| Marketing | Avoid survival hype; it fuels Quinnipiac fears |
| Trust & Safety | Tie metrics to CSAM classifier launches |
Chart and citation
Roser embeds an interactive chart comparing question wordings — read the primary article for footnotes linking each topline PDF.
Search intent FAQ expansion
Why do Americans think AI is bad for society? Roser does not assign causes — polls measure mood, not reasons. Journalists cite jobs, deepfakes, and data centers; your product team should run qualitative interviews rather than guessing from one percentage.
Will concern fall after better models? Pew’s trend since 2021 suggests concern grew as models improved — capability alone has not bought trust.
Should startups ignore polls and ship? Ignoring 73% survival concern risks regulatory backlash; engaging transparently may be slower but durable.
Communicating with policymakers
When testifying or briefing staffers, lead with probability methods Roser lists — lawmakers distrust viral stats. Bring Pew and Quinnipiac PDFs, not screenshots. Tie recommendations to specific risks (deepfakes, labor displacement, grid load) rather than abstract anti-AI sentiment.
Enterprise sales objections
Procurement may cite “majority negative” polls to delay renewals. Counter with measurable safety metrics from your eval program, not benchmark brags. Link third-party audits where they exist, similar to OpenAI Apollo embedded evaluations narrative.
Education sector buyers
School districts read exam cheating headlines alongside OWID charts. Vendors pitching classroom AI should expect Korea-style proctoring questions soon — see South Korea tax exam reforms.
Citation for slides
Use Roser’s BibTeX entry from OWID when presenting — it links the archive URL so slides survive later site updates.
Dataset openness
Roser links topline PDFs for each poll — download them when building internal dashboards rather than scraping our paraphrase. Primary PDFs include question exact wording, critical for legal compliance reviews.
Non-US readers
explainx.ai’s audience is global. US negativity does not imply identical curves in India, EU, or Southeast Asia — but OWID’s methodology post is a template: combine probability samples, reject opt-in noise, show wording sensitivity.
Media training angle
Spokespeople should avoid saying “the public just does not understand AI.” Roser’s data shows informed panelists with strong negatives. Acknowledge tradeoffs — jobs, environment, misuse — then cite specific safeguards your product implements.
Investor relations
Public companies may face shareholder proposals on AI ethics when 73% survival concern headlines circulate. OWID is not investment advice, but IR teams should monitor Quinnipiac drops as reputational indicators.
Final takeaway
Negative majorities are now the default prior for US audiences in late 2026. Product, policy, and comms teams that plan for skeptical users will outperform teams that still assume launch applause alone. Roser’s OWID synthesis is the cleanest single page to cite when leadership asks for hard evidence, not social vibes. Bookmark the OWID archive URL in your wiki so updates do not break slide links mid-quarter.
Related surveys outside Roser’s chart
Roser did not include every US poll in existence — only five high-quality items. If your stakeholder cites a different survey, apply the same probability-sample filter before debating the percentage in executive meetings, board materials, or earnings call prep documents.
Accurate as of November 17, 2026. Statistics follow Max Roser’s Our World in Data article and linked survey toplines.